
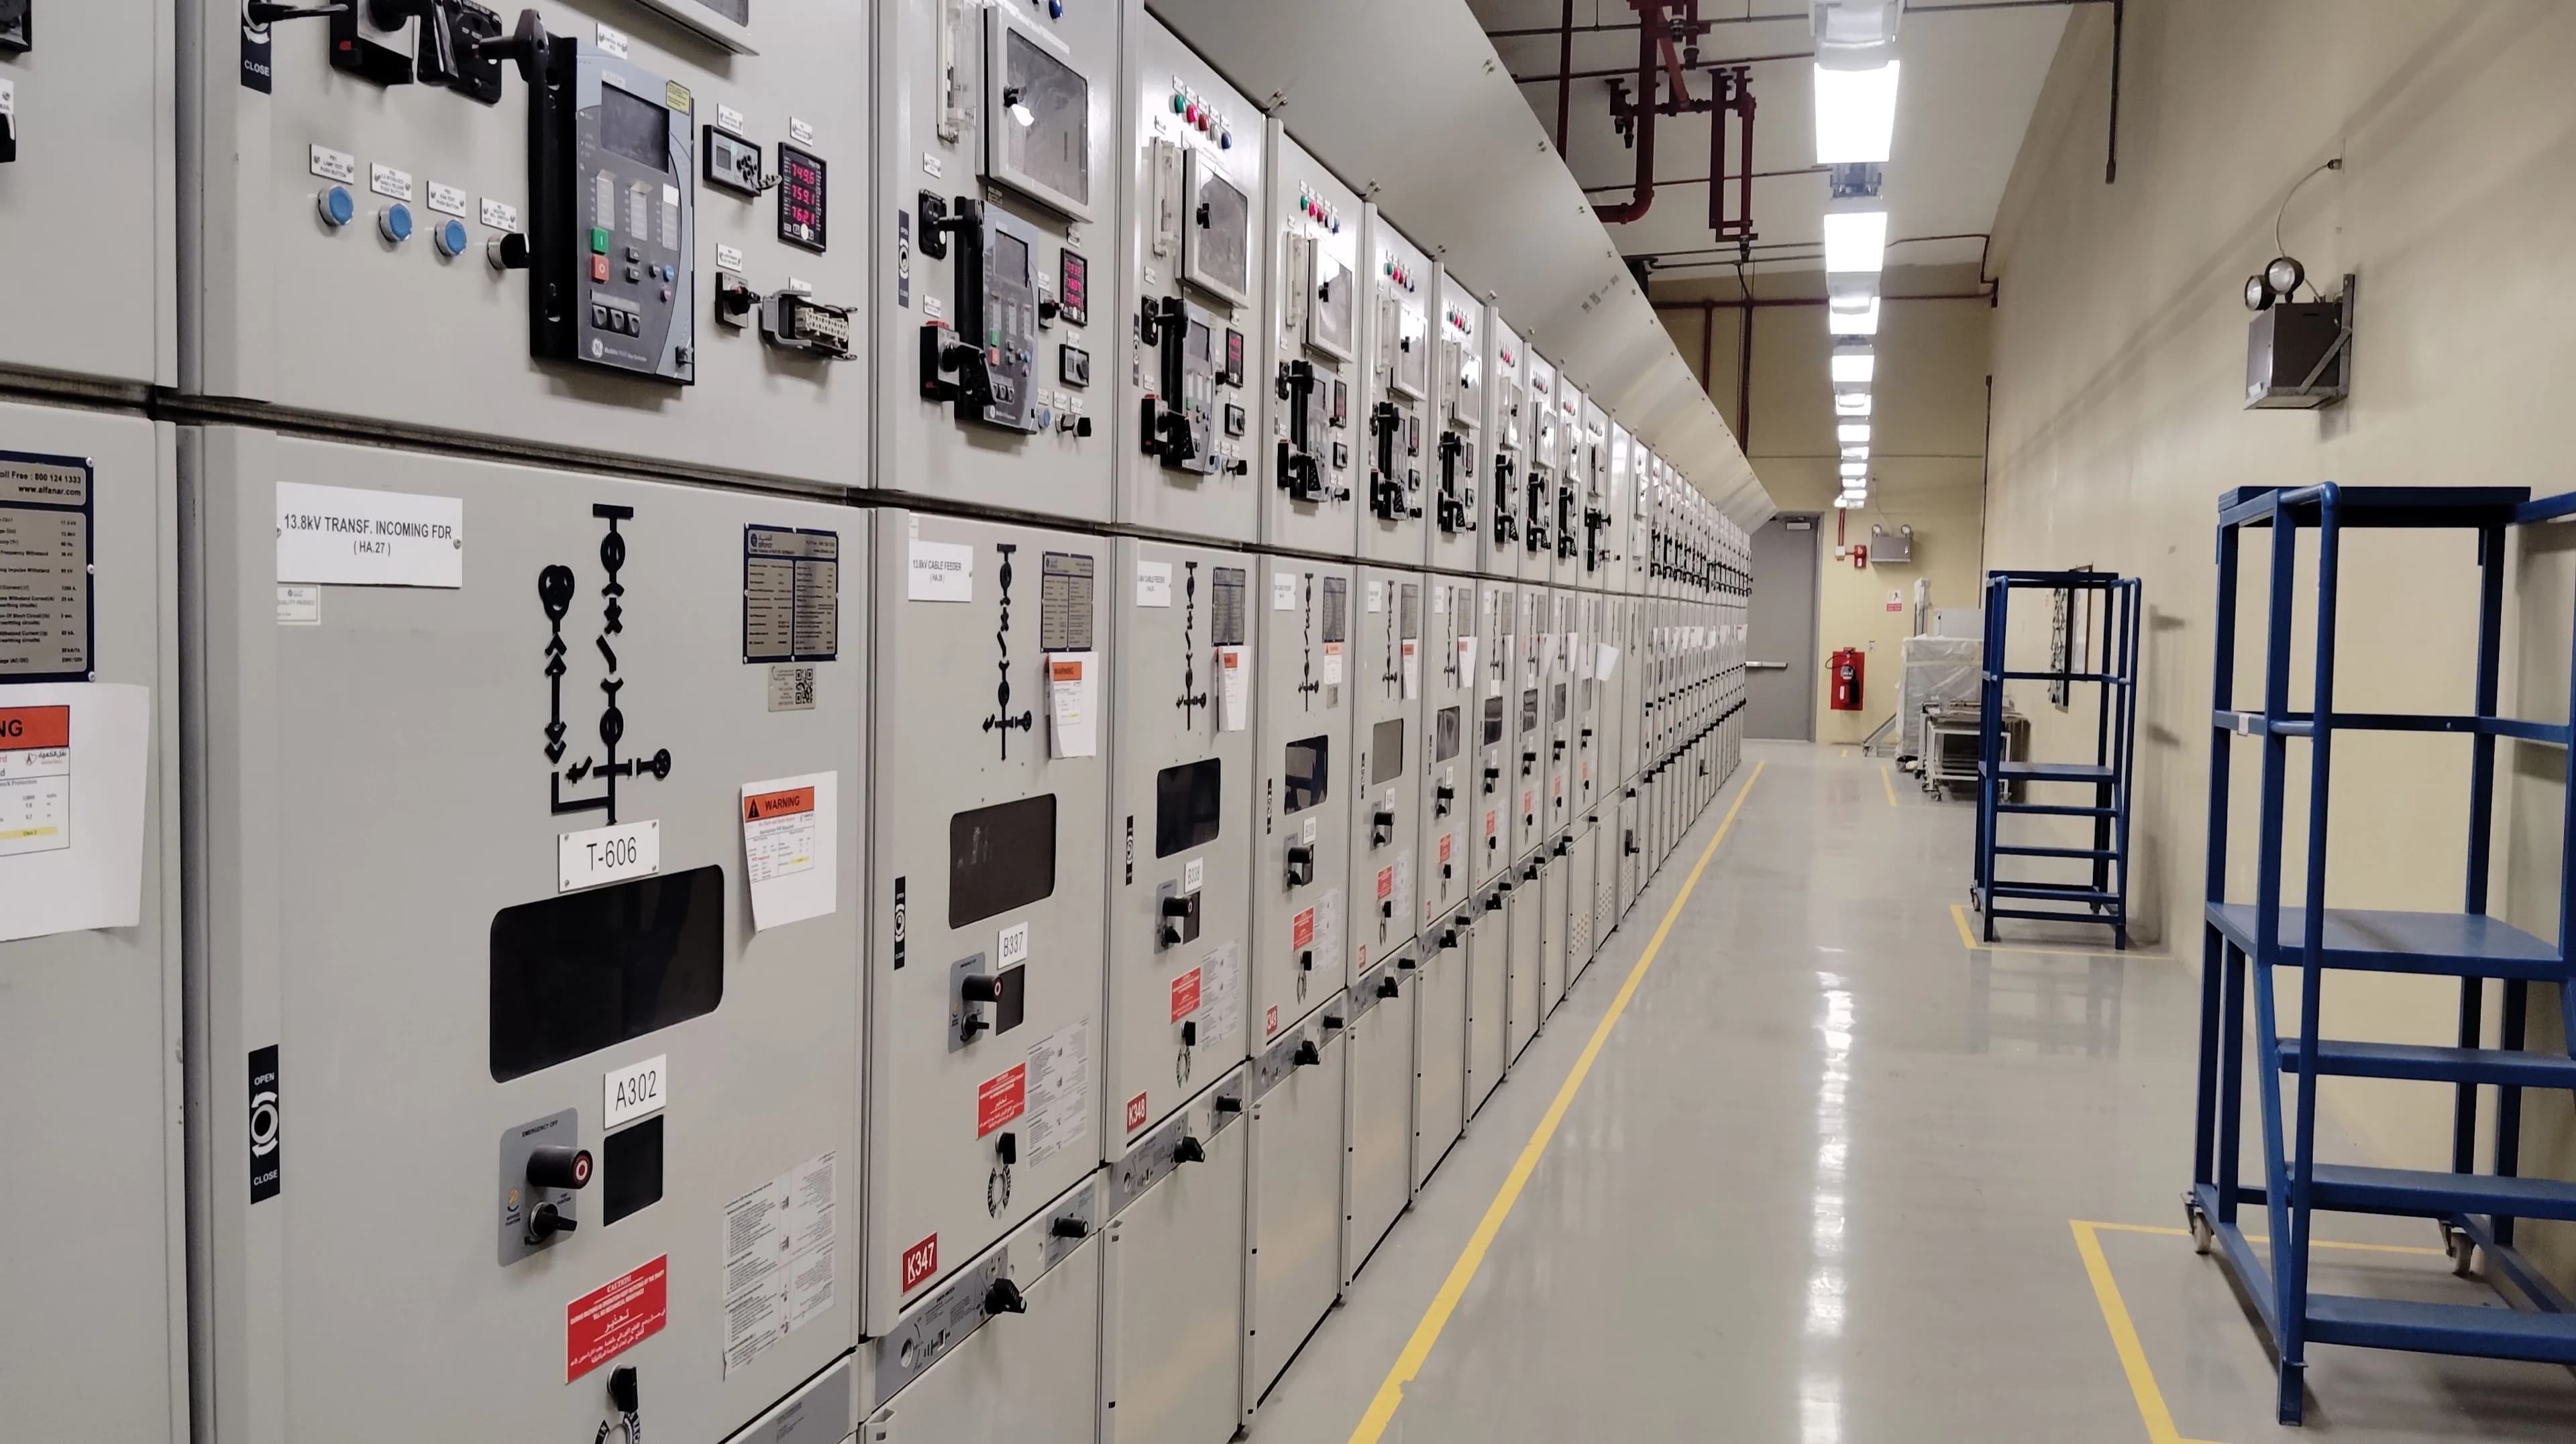
10 MW Data Center
Investment Financials
GIFT City, Gandhinagar — Tier IV · Incentive-adjusted, Q3 2026. An interactive, illustrative investment model. Pick a financing structure, explore any year of the project, or jump straight to an exit plan.
80:20 = 80% bank debt to 20% investor equity.
Total wealth this creates for you — before any exit plan
₹0 Cr
back on ₹208 Cr invested, over 15 operating years — 26.93% equity IRR, full incentive + land scenario.
Worst case — zero incentives
₹1,363 Cr · 13.54%
Payback
~5 yrs after operations begin (~9 years from first investment)
This is the total cash that comes back to you over the full 15-year hold, undiscounted — not a discounted NPV (that’s shown separately, further down, at a realistic 12% hurdle rate). Want to exit earlier instead? Scroll to the year-by-year exit plans below.
What it costs to build, and how it's financed
Total project cost
₹0 Cr
₹1038 Cr to build + ₹189 Cr interest capitalized during the 4-year construction period. About ₹123 Cr per MW of IT capacity.
Investor equity — 20%
₹0 Cr
Called over 16 quarters, netted against the capex subsidy.
Bank loan — 80%
₹0 Cr
At 8.5% interest, 1-year moratorium, 14-year tenure.
Land
2.5 acres
~₹60 Cr/acre, GIFT City SEZ premium.
Rental rate (MRR)
₹/kW/mo
10–20 kW racks, Tier IV-grade quality.
Peak net exposure
₹82.03 Cr
at Quarter 6 — not the full ₹208 Cr ticket.
Gujarat Government Incentives — Gujarat IT/ITeS Policy 2022–27
₹200 Cr cap
Capex reimbursement, Category II (Mega) — verified against the written GR.
₹40 Cr/yr
Opex reimbursement, 15% of actual spend, for 5 years.
Scheme window closes 1 January 2027 — sanction needed by 31 December 2026
Viewing the 80:20 structure.
Where the construction cost actually goes
Power Infrastructure
Depreciated over years
₹ Cr%
Cooling Infrastructure
Depreciated over years
₹ Cr%
Civil Construction (Shell)
Depreciated over years
₹ Cr%
Land
Not depreciated — acres at ~₹ Cr/acre
₹ Cr%
White Space Fit-out
Depreciated over years
₹ Cr%
DG Package
Depreciated over years
₹ Cr%
Design & Engineering
Soft cost, expensed
₹ Cr%
Prelims & GC Indirects
Soft cost, expensed
₹ Cr%
Fire Suppression & Life Safety
Depreciated over years
₹ Cr%
Security & Access Control
Depreciated over years
₹ Cr%
DCIM + BMS
Depreciated over years
₹ Cr%
Exact category-level figures, useful life and percentage weightings are covered under NDA. Sinojia Capital can walk you through the full breakdown directly, or provide an estimate on request.
Contact UsEquity IRR, layer by layer
Baseline — no incentives
13.54%
The floor to underwrite against — zero incentive capture, at 80:20 leverage.
+ Capex subsidy
24.27%
+10.73pp over baseline. Gujarat's ₹200 Cr capex incentive, reimbursed against actual construction spend on a 1-year lag.
+ Capex + Opex subsidy
25.94%
+1.67pp further. Adds the ₹40 Cr/year operating-cost incentive.
+ Land appreciation (7%/yr)
26.93%
+0.99pp further. A conservative land-value floor compounding to the Year-15 exit.
Minimum — underwrite to this
13.54%
Zero incentives. ₹1363 Cr back on ₹208 Cr in.
Possible — full execution
26.93%
Incentives + land. ₹2005 Cr back on ₹208 Cr in. ~5 yrs after operations begin (~9 years from first investment) — cumulative equity turns positive in Year 6 of operations.
What the land could add — three cases
Reference — land held at cost (no appreciation)
25.94%
Equity IRR · NPV @12% ₹230 Cr · ₹1,613 Cr back on ₹208 Cr in
Conservative — FD-comparable
Land +7% a year
26.93%
Equity IRR · +0.99 pts over land at cost
- NPV @12%
- ₹281 Cr
- Cash back on ₹208 Cr in
- ₹2,005 Cr
- Money multiple
- 9.6×
- Land value at exit
- ₹542 Cr
- Implied land price
- ₹217 Cr/acre
- Total sale value of asset
- ₹1,127 Cr
The minimum land return we assume, in the range of fixed-deposit returns.
Realistic — base case
Land +15% a year
29.84%
Equity IRR · +3.89 pts over land at cost
- NPV @12%
- ₹488 Cr
- Cash back on ₹208 Cr in
- ₹3,598 Cr
- Money multiple
- 17.3×
- Land value at exit
- ₹2,135 Cr
- Implied land price
- ₹854 Cr/acre
- Total sale value of asset
- ₹2,719 Cr
GIDC's official Gandhinagar prices for general industrial land grew about 15% a year; SEZ-designated land grew about 10%.
Upside
Land +20% a year
32.91%
Equity IRR · +6.97 pts over land at cost
- NPV @12%
- ₹834 Cr
- Cash back on ₹208 Cr in
- ₹6,255 Cr
- Money multiple
- 30.1×
- Land value at exit
- ₹4,792 Cr
- Implied land price
- ₹1,917 Cr/acre
- Total sale value of asset
- ₹5,377 Cr
An illustrative upside above the published evidence — we found no source that supports 20% a year as a long-run land rate.
Land appreciation is a wealth effect on the exit value — it lifts IRR, NPV and total cash back, but does not change payback speed. Land is assumed to compound from purchase for 19 years (4 construction + 15 operating), then sold with the asset.
The 15% case matches GIDC’s official Gandhinagar allotment prices for general industrial land (about 15.1% a year, FY 2021-22 to FY 2023-24); SEZ-designated land in the same circulars grew about 10% a year. The 20% upside is illustrative and sits above the published evidence we found. These are scenarios, not forecasts — realised land value depends on location, market and timing, and is not guaranteed. IRR and NPV use the same equity cash flows as the rest of this page, with land value added at exit.
Pick any year. See exactly what happens.
Year 6(Operating Year 2)
Exit window85% of capacity leased
We hold 85% leased as the assumption every year from here on — this project never assumes a full 100% sellout. The unleased 15% is a deliberate margin, not a shortfall.
Revenue
₹220.5 Cr
Operating costs
−₹55.3 Cr
EBITDA
75% margin
₹165.2 Cr
Depreciation
−₹33.5 Cr
EBIT
₹131.7 Cr
Interest
−₹86.7 Cr
Tax paid
−₹11.3 Cr
Profit after tax
₹33.7 Cr
Loan outstanding
₹941 Cr
Cash & liquid reserves
Still funded by committed capital, not a cash cushion yet
−₹30 Cr
Cash from operations
₹67.2 Cr
Net cash to you, this year
−₹5.7 Cr
Profit after tax
₹33.7 Cr
Cumulative position is still negative (−₹31.8 Cr) — investors haven't broken even yet. This year's own cash flow is still negative, mainly a function of loan interest during this early stretch of operations.
Peak exposure during construction: ₹82.03 Cr · Cumulative exposure through this year (construction + operations): −₹31.8 Cr
Exit plan — sell the asset at the end of Year 6
Sale value (15× EBITDA)
₹2,140 Cr
Proceeds to investors
₹1,199 Cr
₹941 Cr of the sale price goes toward paying off the 92% of the loan still outstanding
Money multiple
5.92×
Net gain ₹1,167 Cr
Equity IRR
81.15%
NPV @12%: ₹640 Cr
If the buyer pays less than 15×
| Multiple | Proceeds | Money multiple | Equity IRR |
|---|---|---|---|
| 15×base case | ₹1,199 Cr | 5.92× | 81.15% |
| 12× | ₹771 Cr | 4.11× | 67.15% |
15× is our base case, drawn from two disclosed India data center deals — not a guarantee, and no buyer is committed today.
See the data center M&A precedents and market research behind this assumption→The full 30-year picture
Operating profit (EBITDA) over 30 years
₹0 Cr
On ₹13,188 Cr of revenue. The first 15 years are the base case — Years 16–30 show earning capacity beyond it.
Where the money goes — 30 operating years
Plus ₹250.7 Cr of government subsidy (capex + opex) — most of the capex portion refunds your equity during the build.
Returns by holding period — land at cost
| Hold for | IRR | NPV@12% | Asset value |
|---|---|---|---|
| 15 yrs | 25.94% | ₹230 Cr | ₹735 Cr |
| 20 yrs | 26.27% | ₹300 Cr | ₹593 Cr |
| 25 yrs | 26.59% | ₹368 Cr | ₹571 Cr |
| 30 yrs | 26.73% | ₹422 Cr | ₹549 Cr |
If land appreciates 7%/yr
| Hold for | IRR | NPV@12% | Asset value |
|---|---|---|---|
| 15 yrs | 26.93% | ₹281 Cr | ₹1127 Cr |
| 20 yrs | 26.71% | ₹345 Cr | ₹1204 Cr |
| 25 yrs | 26.78% | ₹407 Cr | ₹1488 Cr |
| 30 yrs | 26.82% | ₹454 Cr | ₹1896 Cr |
Net gain over the full life
₹0 Cr
₹6,845 Cr returned (incl. ₹549 Cr of asset value at Year 30) less ₹260 Cr paid in.
Money multiple
26.4×
With land appreciating 7%/yr
₹7,932 Cr net gain
Loan fully repaid
Year 14
Years 15–30 are completely debt-free.
Debt-service cover (min · avg)
0.79× · 1.44×
Cash back in full
Operating Year 6
Max net out-of-pocket: ₹77 Cr
A fairer comparison
Equity NPV @ 12%
₹281 Cr+
Project NPV @ WACC (7.49%)
₹412 Cr+
In plain words
IRR
The effective yearly “interest rate” your money earns across the whole investment — like a compounding FD rate, but for this project.
NPV
Today's value of every future rupee you'll receive, after discounting for the fact that money later is worth less than money now. A positive NPV means the deal is worth doing.
EBITDA
Operating profit before interest, tax and depreciation — the yearly cash the data center earns from running.
Payback Period
How many years until the cash you've received equals the money you originally put in — after this, it's all profit.
Book Value
What the buildings and equipment are still worth on the books after wear-and-tear (depreciation) is deducted. It is an accounting figure, not a market price.
DSCR
Debt-Service Coverage Ratio — operating cash flow divided by that year's loan payment. Lenders typically want at least 1.2–1.3×.
What could reduce returns — and what could help
What could reduce returns
Act Fast — The Scheme Window Is Closing
This incentive scheme runs out on 1 January 2027. Land purchase, DPR filing, full paperwork, and eligibility criteria all need to be completed — and the project needs to be sanctioned under the scheme before 31 December 2026 — for these numbers to apply.
Interest Rates
Loan cost is modeled at 8.5% — a change in bank terms shifts the debt-servicing burden.
Opex Subsidy Is the Real Number, Not the Ceiling
Figures use this project's actual opex (15% of real spend) — not the theoretical ~₹200 Cr ceiling, which is only reachable via artificially inflated opex.
The Sale Is Not Guaranteed
An early-exit plan needs a buyer at or near the assumed multiple. Market conditions, data center demand and interest rates at the time will decide the real price.
Not included — likely upside
Leasing Ramp-Up Is Already Conservative
Year 1 assumes only 42.5% leased, Year 2 ramps to 85%, capped at 85% for the full period. Full sellout or faster lease-up improves returns further.
Real Operating Life Runs Longer Than 15 Years
A data center's real working life typically runs 25–30 years; the 15-year base case stops early, with the loan already repaid by Year 14.
Sale Costs and Tax Are Not Deducted (Exit Scenarios)
Advisory and transaction costs typically run ~1–3% of sale value. Tax on the gain depends on investor type and structure and is not deducted — confirm with a tax advisor.
Delays Are Already Buffered
The 4-year build timeline is deliberately conservative. A faster build (industry range: 2–3.5 yrs) only cuts interest cost and improves these numbers.
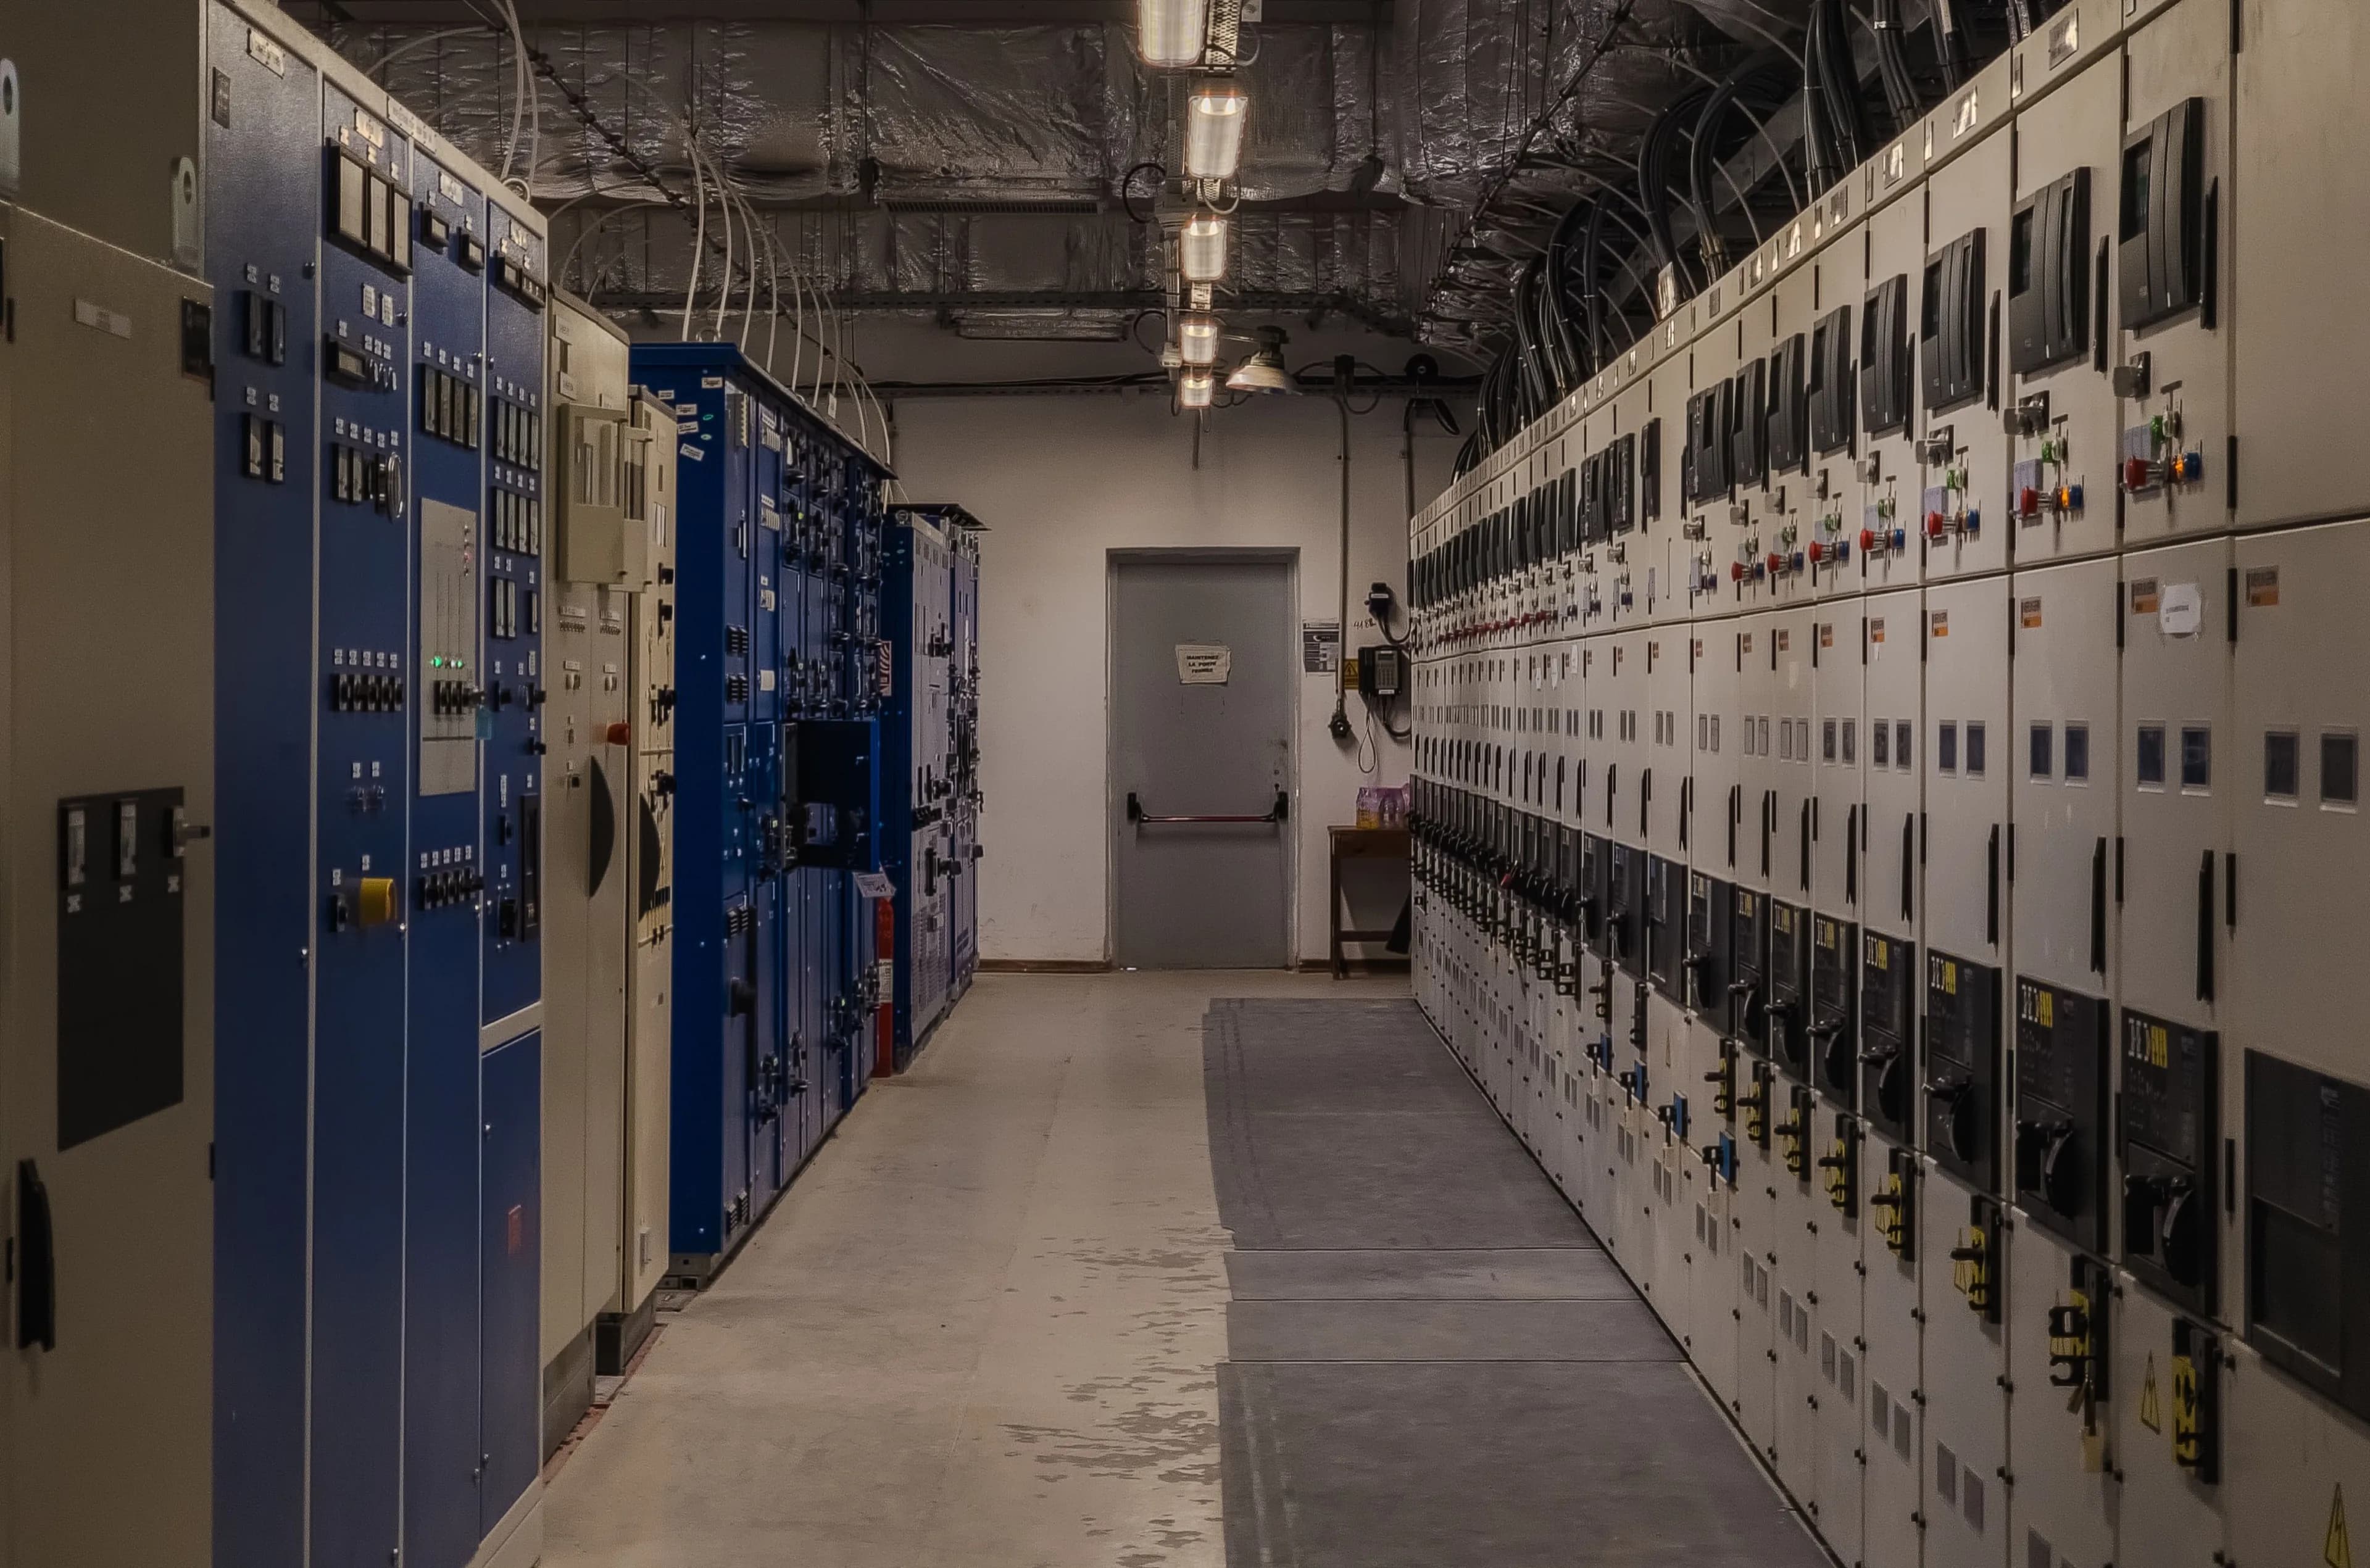
Want the full financial model?
Or your own scenario?
These financials layer real, verified figures onto our base model. The complete Excel workbook — every scenario, every incentive layer, fully editable assumptions — is available on request.
Strictly Private & Confidential
Illustrative model only — not investment advice or a securities offering. Figures subject to change on final structuring.
© 2026 Sinojia Capital Infratech LLP. All rights reserved. This document and its contents are proprietary and confidential, intended solely for the named recipient, and may not be reproduced, distributed or disclosed to any third party without prior written consent.